Documentation Index
Fetch the complete documentation index at: https://lightdash-docs-ai-agents-period-comparisons.mintlify.app/llms.txt
Use this file to discover all available pages before exploring further.
Core capabilities
AI agents in Lightdash allow you to:- Ask questions in natural language - Simply type what you want to know about your data, like “What’s our total revenue by region?” or “Show me user growth over the last 6 months”
- Get instant visualizations - Receive bar charts, time series, and tables automatically generated based on your questions
- Explore interactively - Follow up with additional questions, drill down into specific data points, or request different chart types
- Maintain conversation context - AI agents remember your conversation history, so you can build on previous questions and refine your analysis
- Provide text-only responses - Get answers in natural language when visualizations aren’t needed
- Guide you to the right data - Direct you to the most relevant explores or tables for your questions
- Discover existing content - Find and share relevant charts and dashboards that have already been created in your project
- Generate complete dashboards - Create multiple related visualizations at once that tell a cohesive story about your data, perfect for executive summaries or thematic analyses
Asking about a chart or dashboard
You can launch an AI conversation with a chart or dashboard pre-loaded as context. From the resource’s⋯ menu, click Ask AI Agent.
This opens a new tab on the new-thread page for your default agent. The chart or dashboard appears as a pinned context card above the input, and the agent treats it as the subject of the conversation.
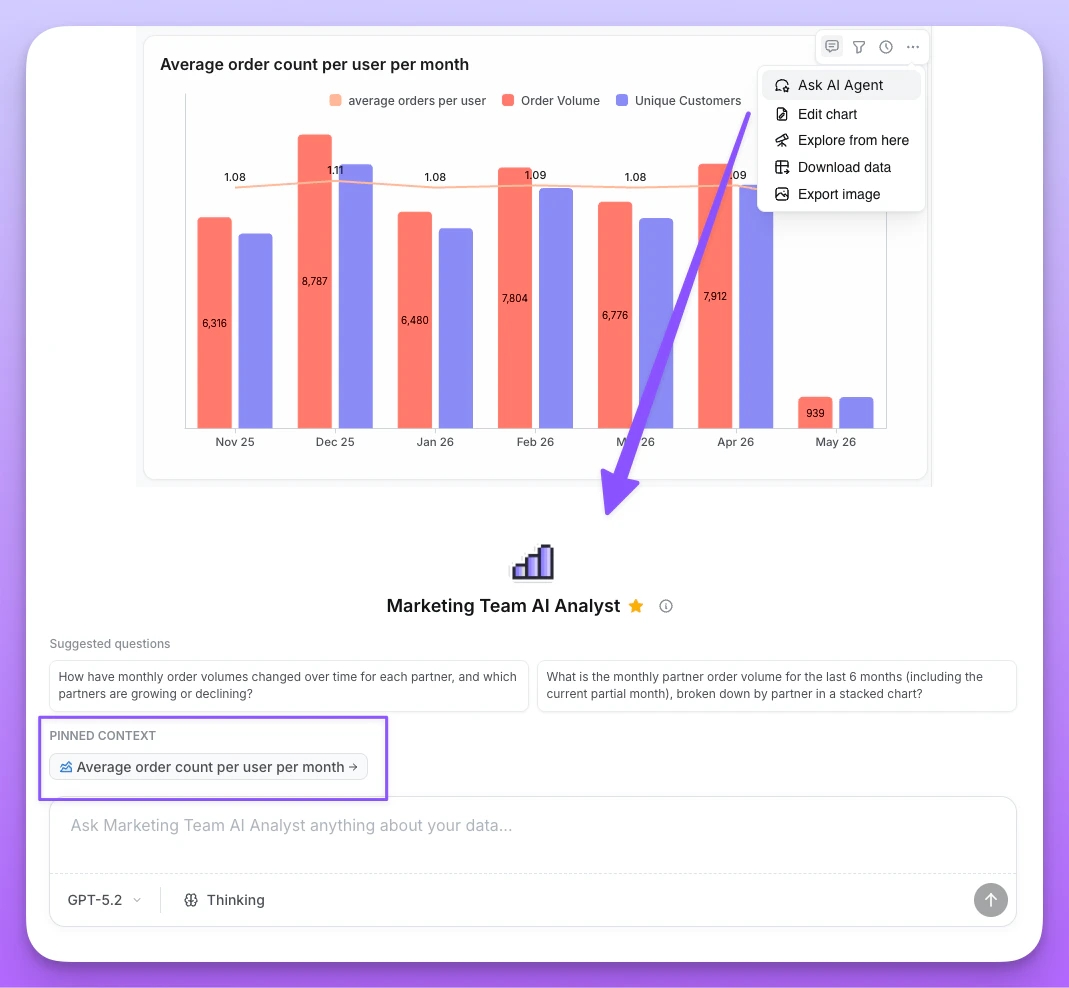
Pinned context
- The pinned card stays visible above your message in the thread, so anyone reading later can tell what was being discussed.
- Click the pinned card to open the chart or dashboard in a new tab.
- The pinned context persists across follow-up messages — “now break it down by region” still refers to the originally pinned chart.
What you can ask
When you pin a saved chart, the agent can read its actual data (subject to your data access setting). It honors the chart’s saved filters, sorts, and custom metrics, so you can ask:- “Why is this trending up?”
- “Are there outliers in this chart?”
- “Compare this chart’s last 30 days to the previous period.”
Example use cases
Period-over-period comparisons
AI agents can build period-over-period (PoP) queries directly from a natural language prompt. Ask for “revenue vs last month”, “year-over-year users”, or “compare this quarter to the previous one”, and the agent adds a shifted comparison column next to the base metric — no need to open the period comparison modal yourself. What you can ask:- “Show revenue by month, with previous-month comparison.”
- “Year-over-year users by quarter.”
- “Compare orders this week to the same week last year.”
- “MoM and YoY revenue in one chart.”
Revenue plus Revenue (Previous month)). Multiple comparisons on the same metric — such as month-over-month and year-over-year — appear as separate columns.
Requirements the agent enforces:
- The query must include a time-interval dimension (such as
orders_created_at_month) — the agent adds one if your prompt doesn’t. - The comparison granularity must match the dimension’s time interval (
DAY,WEEK,MONTH,QUARTER, orYEAR).HOURand raw timestamps aren’t supported. - The period offset must be at least
1. Use1for the previous period,12withMONTHgranularity for the same month last year,4withQUARTERfor the same quarter last year, and so on.
- Month-to-date and year-to-date totals. These are filtered aggregations, not period shifts. Ask the agent for a custom metric with a date filter instead.
- Growth rate or percent change columns. The PoP column is generated by the agent, so it can’t yet be referenced from a table calculation in the same query. Pull the comparison first, then add the percent-change calculation in the explorer.
Advanced visualizations with window functions
AI agents can handle complex analytical queries that would traditionally require writing intricate SQL or YAML configurations. In this example, we demonstrate building a 3-month rolling average visualization using nothing but natural language.
This demo shows:
- Creating complex window function calculations with plain English
- Building a 3-month rolling average without writing SQL or YAML
- AI agent understanding your semantic layer context automatically
- Generating production-ready charts from a single natural language query
- No need to manually configure partitions, ordering, or frame clauses
- From question to visualization in seconds, not hours
FAQs
- Does Lightdash store the query data?
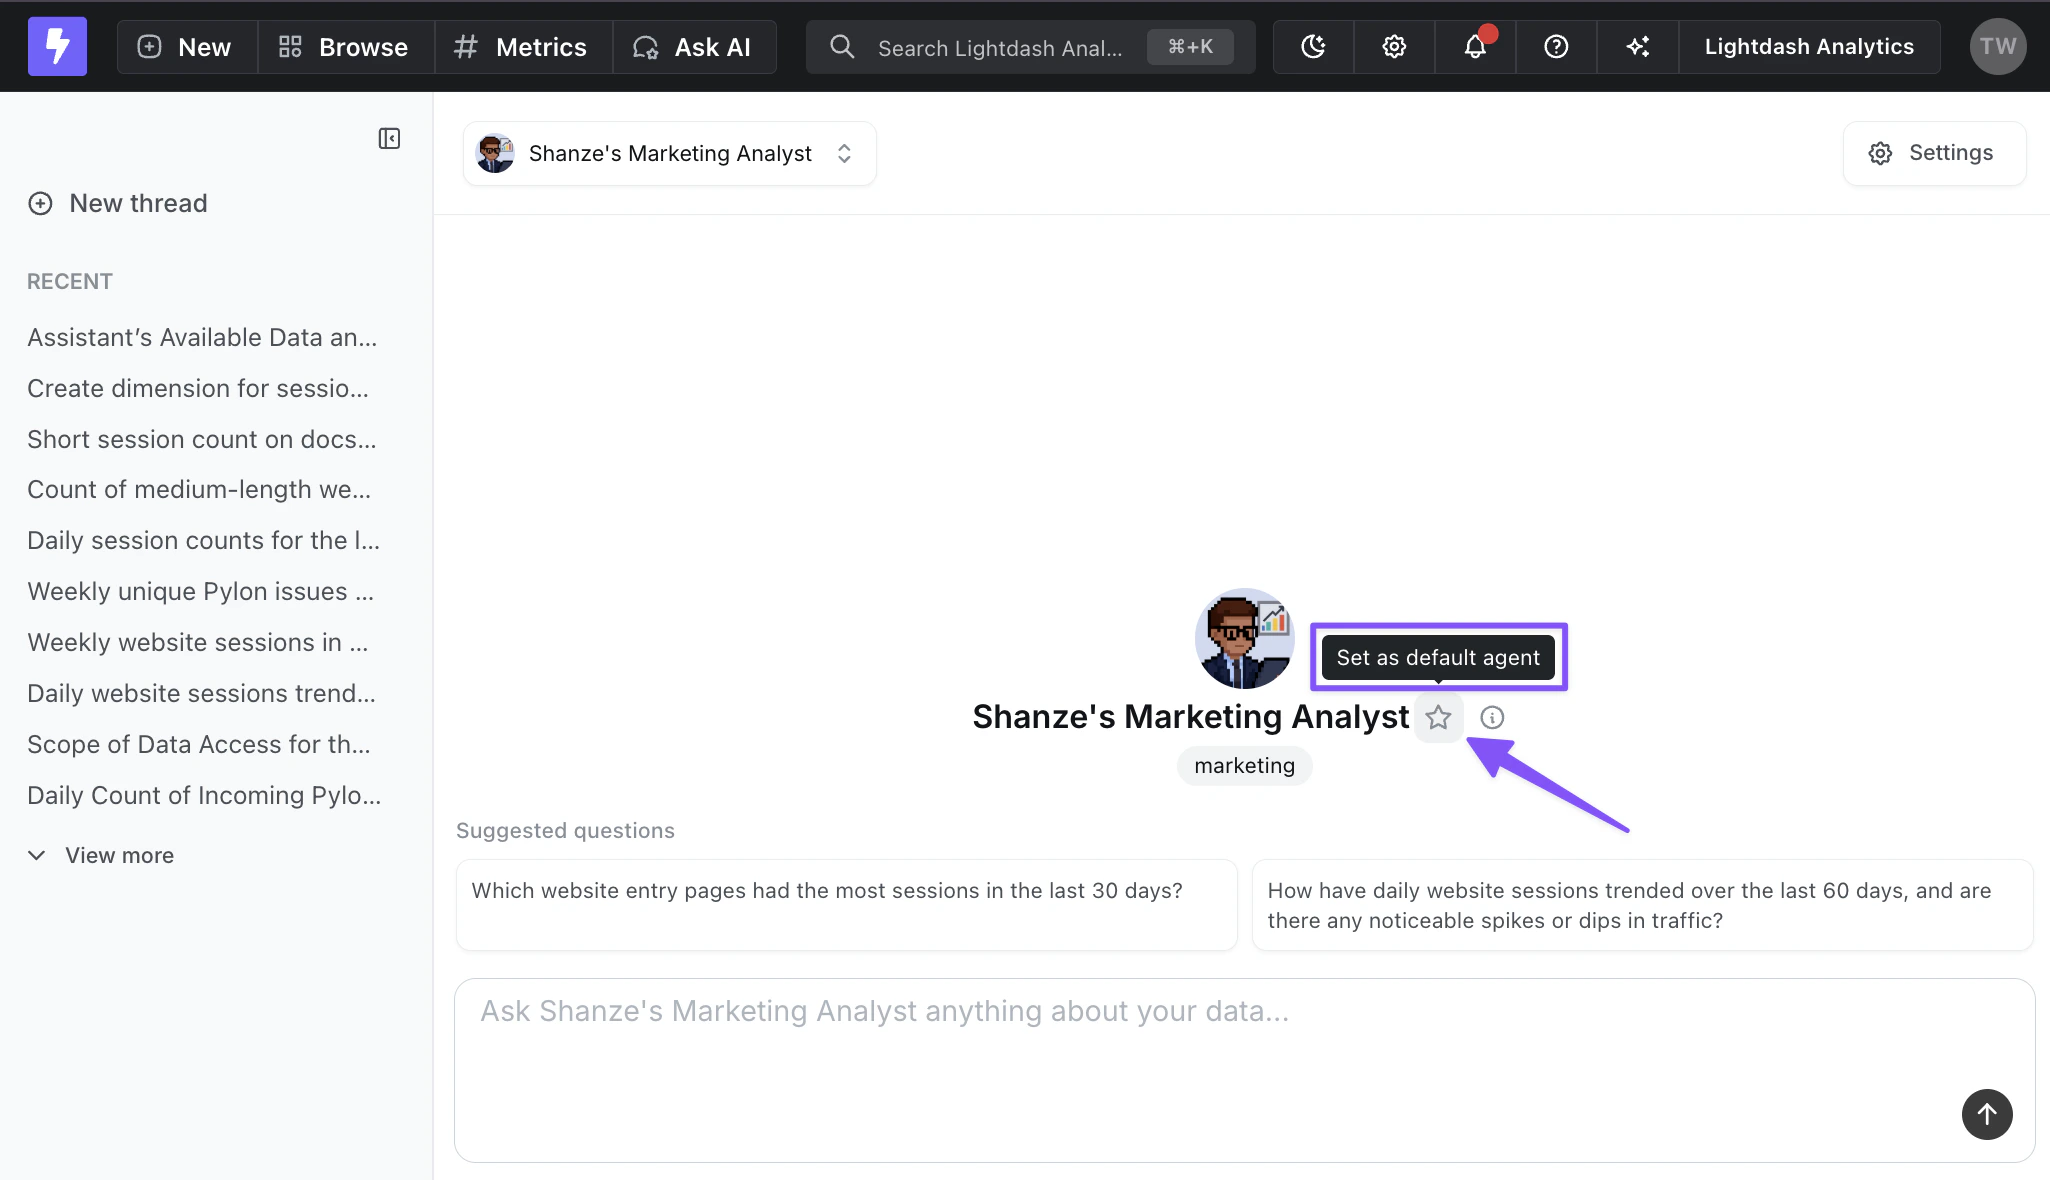
- Can I assign a default agent?